PS1: Classification with kNN
In this assignment, you will write a supervised classifier using kNN for two tasks:
- Predicting whether a person has diabetes based on various health and lifestyle attributes (features)
- Identifying a handwritten digit (0-9) in an image
Click the repository link at the top of the page while logged on to GitHub. This should create a new private repository for you with the skeleton code.
If you are working in a pair, go the Settings > Collaborators and Teams in your repository and add your partner as a collaborator. You will work on the code in this repository together (partners should not have separate repositories).
Clone this repository to your computer and start working. Commit your changes early and often. There's no separate submission step: just fill out honorcode.py and commit.
Please read these instructions for the workflow and commands for managing your Git repository and making submissions.
You are encouraged to use the search for teammates post on Piazza to find partners.
Objective
Understand and implement the k Nearest Neighbors algorithm, and also become familiar with- experimental setup for supervised machine learning: training and test sets, hyperparameter tuning
- data processing and vector computations using Python with NumPy and/or SciPy
If you need a Python refresher, the Wellesley CS111 page is a good place to start. Go through the slides and notebooks linked from the lectures.
Part A: Data Loading and Classification
Download data.zip from this location, unzip it (creating a folder named data), and place it in the directory where you cloned your repository. Do not commit this folder.
Open up the data/pimadiabetes directory. This contains three files with labeled examples for training, development (parameter tuning), and testing.
Each row in a file represents a person of Pima
Native American heritage,
with features values separated by commas.
The very last column is the label, 0 or 1, which denotes whether or not that person has diabetes.
The rest of the columns are, in order,
The above list is for your curiosity only; the computer only needs to see the feature values.
Write the following functions in knn.py:
-
load: reads a file (like data/pimadiabetes/training.txt) and returns a tuple (X, y), where X is a data matrix with row i being the data vector of the ith line in the file, and y is an array with element i being the class label (0 or 1) of the ith line. This function should work for any file of that format. knn_predict: given a training data matrix trainX, the associated training labels trainy, a testing data matrix testX, a positive integer value for n_neighbors (k, the number of nearest neighbors to consider), and a distance metric for distance_metric (either "euclidean" or "manhattan"), return an array containing the predicted labels of each row (in order) in the testing data testX.Check your answer against the result produced by sklearn_knn_predict.
get_accuracy: given an array of true labels and an array of predicted labels, return the relative accuracy (between 0 and 1) of the predictions.confusion_matrix: given an array of true labels and an array of predicted labels as above, return a confusion matrix C, as a 2-d array, with true labels along the rows and predicted labels along the columns. C[i, j] holds the number of data points of label i that were classified as label j.
In the case of binary clasification (labels are 0 or 1), C would be 2x2 array. For example,confusion_matrix([0, 1, 1, 0, 0, 1, 0], [0, 0, 1, 0, 1, 1, 0])should produce the following:array([[ 3., 1.], [ 1., 2.]])This says that- 3 of the data points that were actually 0 were predicted as 0 (C[0, 0]),
- 1 point that was actually 0 was predicted as 1 (C[0, 1]),
- 1 point that was actually 1 was predicted as 0 (C[1, 0]),
- 2 points that were actually 1 were predicted as 1 (C[1, 1]).
The
confusion_matrixfunction should infer the number of classes from its arguments. Hint: use max.
When you're done with this section, comment out the lines in the main function
starting from PART B, and run
python knn.py data/pimadiabetesto get the performance of the algorithm with k=1 and the Euclidean distance metric on the test data.
Part B: Hyperparameter Tuning
Define knn_grid_search which takes the training data vectors
trainX,
the associated labels trainy,
the development data devX,
the associated labels devy,
a list of values of the K hyperparameter in n_neighbors_list,
and a list of distance metrics in distance_metric_list.
For each K and each distance metric specified, this function should train a kNN classifier on the trainX, trainy data, and test its accuracy on the devX, devy data. It should return a dictionary mapping each (metric, k) tuple such as ('euclidean', 3) to the development accuracy using those parameters.
Uncomment the PART B execution code in the main function
and re-run your program on the diabetes dataset.
This uses the development data to find the best hyperparameters,
and applies the kNN classifier with these hyperparameters to the test data.
Part C: MNIST File Formatting
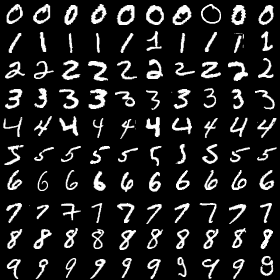
The data/mnist1100 directory contains three folders for training, development (hyperparameter tuning), and testing. Each folder in turn contains folders for each digit (0-9). Each of these folder contains a 2-d (28x28) array representation of the pixels of a grayscale image of a handwritten digit.
We will represent each image as a 784-dimensional (282) feature vector, where each feature is a pixel location. E.g., the first feature would be "what is the pixel at row 0, col 0?", the second feature would be "what is the pixel at row 0, col 1?", etc. The feature values are the corresponding pixel intensities between 0 and 255. This is one of the standard ways of "featurizing" images.
Fill in the functions in mnistparse.py
to convert each image array to a 784-dimensional vector,
and produce training.txt,
development.txt,
and testing.txt
in the same format as the diabetes data.
Re-run knn.py on the resulting dataset
to build a digit recognizer.
Make sure you didn't hardcode in any diabetes-specific numbers in your
knn.py functions that would break
on this new MNIST data.
python knn.py data/mnist1100
Part D: Analysis
Make a copy of this Google Doc, answer the questions, and share it with me. This part requires some time and code execution, so don't leave it to the very last minute. Important: add the link to your copy of the document to README.md.
Congratulations on building a diabetes prediction tool and a fully-fledged digit recognizer!
Complete honorcode.py and README.md and push your code by Thu, Feb 9th at 11:00 pm EST